Contents
Concept of System Designing Tools
In this blog, we are about to discuss the concept of system designing tools, flowcharts, algorithms, types of flowcharts, symbols used in flowcharts, etc. Before continuing to the topic, if you don’t know or want to know about information systems, system analyst, and system development life cycle, system development models, system development phases, then visit the link below:
Introduction
System design is the process of defining the architecture, components, modules, interfaces, and data for a system to satisfy specified requirements. System design could be seen as the application of systems theory to product development. The tools which are used to design the system are known as system design tools. Following are the tools which are used to design the system.
- Context diagram
- Data Flow Diagram (DFD)
- E-R Diagram
- Algorithm
- Flowchart
- Pseudo Code
- Use Case
- Decision Tree
- Decision Table
- Unified Modelling Language (UML)
Context Diagram
A context diagram is a top-level data flow diagram. It only contains one process node that generalizes the function of the entire system relationship to external entities. It provides no information about the timing, sequencing, or synchronization of processes such as which processes occur in sequence or in parallel. Therefore it should not be confused with a flowchart or process flow which can show these things. Some of the benefits of the Context Diagram are:
- Shows the scope and boundaries of a system at a glance including the other systems that interface with it.
- No technical knowledge is assumed or required to understand the diagram.
- Easy to draw and amend due to its limited notation.
- Easy to expand by adding different levels of DFDs.
- Can benefit a wide audience including stakeholders, business analysts, data analysts, developers.
 |
| Fig. Context Diagram Example |
Data Flow Diagram (DFD)
A data flow diagram (DFD) is a graphical representation of the “flow” of data through an information system, modeling its process aspects. A DFD is often used as a preliminary step to create an overview of the system, which can later be elaborated. DFDs can also be used for the virtualization of data processing (structured design). A data flow diagram (DFD) illustrates how data processing (structured design). A data flow diagram (DFD) illustrates how data is processed by a system in terms of inputs and outputs. As its name goes and how it gets stored.
It also shows what kind of information will be input to and output from the system, where the data will come from and go to, and where the data will be stored. It does not show information about the timing of the process or information about whether processes will operate in sequence or in parallel (which is shown on a flowchart).
 |
| Example of DFD |
E-R Diagram
An entity-relationship diagram (ERD) is a graphical representation of an information system that shows the relationship between people, objects, places, concepts, or events within that system. An ERD is a data modeling technique that can help define business processes and can be used as the foundation for the relational database.
 |
| Example of ER Diagram |
Algorithm
The algorithm is a set of steps that are followed in order to solve a mathematical problem or to complete a computer process. The word “algorithm” is derived from the name of the Arabian mathematician Al-Khwarizmi, which means a method, technique, or procedure. It is the most commonly used tool by the programmer for planning the program and solving the problems. It is an effective method for solving a problem.
An algorithm is a specific set of instruction or rules for carrying out a procedure or solving a particular problem.
a. Algorithm to calculate the area of a rectangular box.
Step 1: StartStep 2: Read the length of a box, say LStep 3: Read breadth of a box, say BStep 4: Area = L*BStep 5: Display AreaStep 6: Stop
b. To Display the sum of even numbers from 1 to 100.
Step 1: StartStep 2: Suppose n=1: Sum = 0Step 3: Divide n by 2, If remainder is 0 then Sum = sum + nStep 4: Increase n by 1Step 5: If n<=100 then go to step 3 else go to step 6Step 6: Show the sumStep 7: Stop
Flowchart
A flowchart is a diagrammatic or pictorial representation of a problem or algorithm that illustrates the sequence of operations to be performed. A flowchart is a formalized graphic representation of a logic sequence, work or manufacturing process, organization chart, or similar formalized structure. The purpose of the flow chart is to provide people with a common language or reference point when dealing with a project or process. Flowcharts use simple geometrical symbols and arrows to define relationships. Generally, flowcharts are classified into the following two types. They are:
System Flowchart
A system flowchart is a diagram showing an overview of the processing in a complete system or it explains how a system works using a diagram. System flowcharts are a way of displaying how data flows in a system and how decisions are made to control events. To illustrates this, symbols are used. They are connected together to show what happens to data and where it goes. The basic ones include symbols used in flow charts.
 |
| Standard symbols used in system flowcharts |
 |
| Example of system flowchart for transaction processing system |
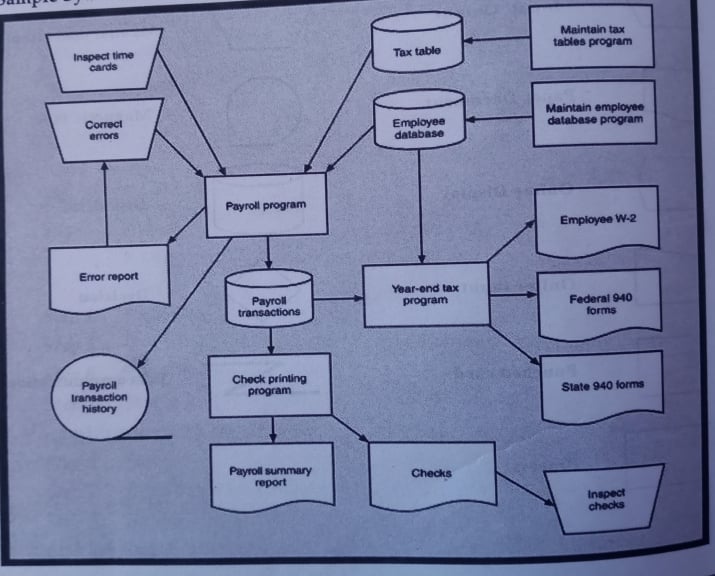 |
| System Flowchart for payroll system |
Program Flowchart
The flowchart which is directly converted into the program is known as a program flowchart.
 |
| Symbols used in program flowchart |
Pseudocode
Pseudocode is one of the system development tools in which the preliminary steps of solutions are written using simple English language rather than programming keywords. It is an informal high-level description of the operating principle of a computer program or other algorithm. The pseudocode uses the structural conventions of a normal programming language but is intended for human reading rather than machine reading. Pseudocode typically omits details that are essential for machine understanding of the algorithm, such as variable declarations, system-specific code, and some subroutines.
Pseudocode to display natural numbers from 1 to 10
beginN=1Repeat{Display NN=N+1}While n<=10halt
Use case
In software and systems engineering, a use case is a list of actions or event steps, typically defining the interactions between a role (known in the Unified Modeling Language as an actor) and a system, to achieve a goal. The actor can be a human or other external system. In systems engineering, use cases are used at a higher level than within software engineering, often representing missions or stakeholder goals.
It is a methodology used in system analysis to identify, clarify, and organize system requirements. The use case is made up of a set of possible sequences of interactions between systems and users in a particular environment and related to a particular goal. It consists of a group of elements (for example, classes and interfaces) that can be used together in a way that will have an effect larger than the sum of the separate elements combined. The use case should contain all system activities that have significance to the users. A use case can be thought of as a collection of possible scenarios related to a particular goal, indeed, the use case and goal are sometimes considered to be synonymous.
 |
| Simple Use Case Diagram |
Decision Tree
Decision tree provides a graphical representation of decision logic that helps non-computer people find it easy to understand. The principles for the development of decision trees are relative forward. A decision tree is a decision support tool that uses a tree-like graph or model of decisions and their possible consequences, including chance event outcomes, resource costs, and utility. It is one way to display an algorithm.
They are commonly used in operations research, specifically in decision analysis, to help identify a strategy most likely to reach a goal, but are also a popular tool in machine learning. An example of the decision tree is given below:
 |
| Decision tree |
Decision Table
A decision table is a tabular method for describing the logic of the decisions to be taken. The decision table accompanies the flowcharts defining the possible outcomes. A decision table is an excellent tool to use in both testing and requirements management. Essentially it is a structures exercise to formulate requirements when dealing with complex business rules. Decision tables are used to model complicated logic.
 |
| Decision Table |
Unified Modelling Language (UML)
The Unified Modeling Language (UML) is a general-purpose, development, modeling language in the field of software engineering, that is intended to provide a standard way to visualize the design of a system. It is a standard language for specifying, visualizing, constructing, and documenting the artifacts of software systems, as well as for business modeling and other non-software systems. The UML represents a collection of best engineering practices that have proven successful in the modeling of large and complex systems.
 |
| UML Activity Diagram |